 Co., Ltd.")


The scenario is based on a small on-grid Solar PV system without DC energy storage.
The purpose was to online monitor all common electricity parameters for each solar panel string to check their working efficiency and status for maintanance.
For site situation, suppose we have 3 inverters, 48 solar panel strings 576 solar panels in total. For each solar panel string consisted of 12 solar panels and connect to a general DC circuit for power distribution. We will target this DC circuit for monitoring. [Rated current 12A DC, rated voltage 600Vdc]. Also, each inverter connect to 16 solar panel strings.
For the places that we gonna install the energy meter and IoT gateway, they are covered by stable 4G signal.
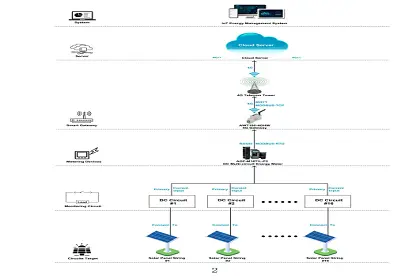
Upstream Comms.: 4G LTE [MQTT, MODBUS Protocol]
Downstream Comms.: RS485 [MODBUS-RTU Protocol]
Support: Up to 25 Downstream Devices via RS485.
Auxiliary Power Supply: 85~265Vac [via AWT100-POW]
Certificate&Standard: CE; CE-RED; IEC

Input: 85~265Vac
Output: 12Vdc
Application: Paired with AWT100-4GHW for 85~265Vac
Power Supply Input [via PIN L & PIN N]
Certificate&Standard: CE

Monitoring: Up 24 DC circuits.
Rated Current: 20A DC (via paired Hall Sensor)
Accuracy: 0.5S
Wired Comms: RS485 Interface, MODBUS-RTU Protocol
Certificate&Standard: CE

Acrel IoT Energy Monitoring System could be access in 2 different ways:
(1) Access through WEB on your computer.
Access port: https://iot.acrel-eem.com/
(2) Access through APP on your mobile phone
Download Link: https://play.google.com/store/apps/details?id=com.acrel.iotems
Access Port: https://iot.acrel-eem.com/
Test Account Name: acrel
Test Account Password: 123456
")
Download Link: https://play.google. com/store/apps/details?id=com.acrel.iotems
Test Account Name: acre
Test Account Pass word: 123456
")
(1) Solar PV Monitoring (2) Devices List (3) History Curve (4) Electricity Parameters Report (5) Energy Consumption Report (Daily, Monthly, Yearly) (6) User Report
(1) Solar Panel String Monitoring: A visualization configuration mapping could be customized and bind the data with the site's monitoring devices. Realize a visualization and digitalization of solar panel working status and efficiency..

(2) Devices List: Showing the overall devices connected to Acrel System and were bond to certain project. SN code, Online-Offline status, devices model and other necessary information will be shown here.

(3) History Curve: Showing the daily history data curve of all the data that could be collected and uploaded by energy meter or other basic metering devices.

(1) Solar PV Monitoring (2) Devices List (3) History Curve (4) Electricity Parameters Report (5) Energy Consumption Report (Daily, Monthly, Yearly) (6) User Report
(3) History Curve: By selecting the items of "date" and "electricity parameter", platform can show the history curve of different data and
date.

(4) Electricity Parameters Report: All the electricity parameters that could be collected by certain energy meter will showed as a report here.

(4) Electricity Parameters Report: Report on platform could be exported in "Excel" format to your computer for a brief storage when accessing the IoT EMS WEB platform.

(1) Solar PV Monitoring (2) Devices List (3) History Curve (4) Electricity Parameters Report (5) Energy Consumption Report (Daily, Monthly, Yearly) (6) User Report
(5) Energy Report (Daily): This Interface show the daily energy consumtion report (calculated by forward active energy)

(5) Energy Report (Daily): This daily energy report could be also export to computer in "Excel" format

(5) Energy Report (Monthly&Yearly): Same as daily energy report, monthly and yearly energyreport could be also checked on platform and exported in "Excel" format.

Main Function of WEB side System:
(1) Solar PV Monitoring (2) Devices List (3) History Curve (4) Electricity Parameters Report (5) Energy Consumption Report (Daily, Monthly, Yearly) (6) User Report
(6) User Report: A comprehensive user report including project overview, energy report, energy analysis and etc could be check on platform

(6) User Report: User report could be exported in "PDF" format into your PC for convenient check and storage.

(6) User Report: User report support template customization in buy-out service of Acrel IoT Energy Monitoirng System.

(1) Devices List (2) History Curve (3) Electricity Parameters Report (4) Energy Trend (5) Energy
Noted: Since APP side and WEB side of Acrel IoT Energy Monitoring System share the same data, normally recommend our user to add the devices to their account using APP and check the data using WEB platform.


